Welcome to our
visualization tool for earthquakes!
Hi! We are Indrė and Guillermo, creators of this amazing tool! Feel free to explore the tool and do not hesitate to contact us if have any questions or suggestions.
Here you will find visualisation for earthquakes since 1st of January in 1998 until 8th of March in 2019. Yes, 21 years of data (which is more than 787000 data point) is visualized for analytical purposes, and maybe even answered the hypothesis that after a certain number of small earthquakes, a big one strikes.

What do we know about earthquakes?
Earthquakes, any sudden shaking of the ground, happen hundreds of times each day. They are caused by the passage of seismic waves which are produced when some form of energy stored in the crust of the Earth is suddenly released.
There are four different types of earthquakes:
- Tectonic
- Induced
- Volcanic
- Collapse
Induce and collapse are caused by human activities and usually are inland and not strong. Meanwhile, volcanic and tectonic earthquakes can make huge damages on the Earth surface as they are a result of movement in Earth crust fault. More
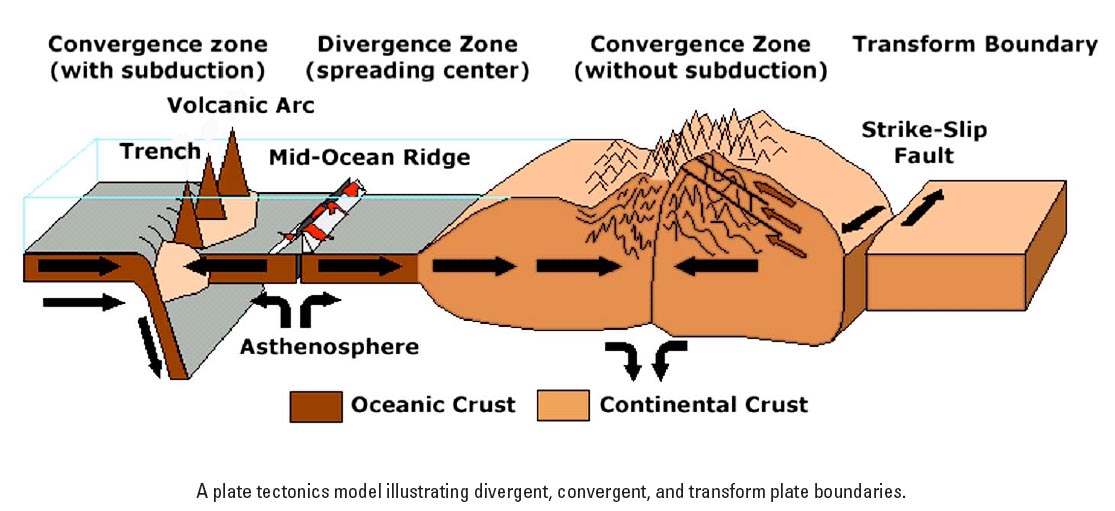
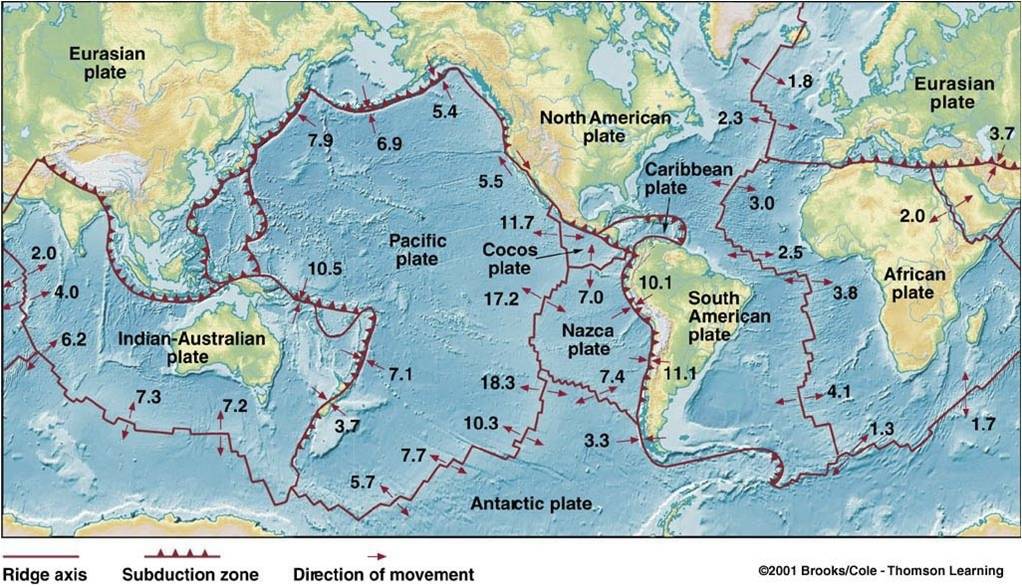
Major earthquakes occur mainly in belts coinciding with the margins of tectonic plates. The most important earthquake belt is the Circum-Pacific Belt, which affects many populated coastal regions around the Pacific Ocean like New Zealand, New Guinea, Japan, the Aleutian Islands, Alaska, and the western coasts of North and South America. It is estimated that 80% of the energy presently released in earthquakes comes from this belt. More
For the reason that Circum-Pacific Belt is associated with volcanic activity, it has been popularly named the Pacific Ring of Fire. Earthquakes usually hit the same place in different magnitude. It has been noticed that they come in clusters and a big quake is surrounded in by smaller shakes. However, this hazard seismic activity is due to Pacific plate compression into North American, Filipino and Australian plates. Where tectonic plate behaviour causes convergent type thrust faults and can exceeded magnitude 9. Similarly active seems to be Nazca and Indian plates. The rest, however, quake the crust slighter, due to extensional and transform plates tectonic environments. More
The magnitude itself is measured using instruments called seismometers that detect the vibrations caused by seismic waves as they travel through the crust. The strength of earthquakes used to be determined according to the Richter Scale, which compares the relative strength of different earthquakes. The scale is logarithmic, meaning that an earthquake of magnitude 5 is ten times stronger than one of magnitude 4. A magnitude 6 quake is 10 times stronger than a magnitude 5, and 100 times stronger than a magnitude 4. The effect of an earthquake depends not only on location it strikes, but also on the depth of the epicenter. More
New technologies help locate the earthquakes and even alert their coming so people can prepare. Un-fortunately, those systems work with a short prediction time (barely a few minutes). A next step for longer-time prediction could be to discover new spatio-temporal patterns in these destructive events. Mapping the data of earthquakes not only by location, but also, by time, in a single view would help researchers and scientists find such patterns and predict earthquakes coming earlier in advance, potentially saving countless lives.